

Eventbrite's Analytics Reports
Eventbrite
Background
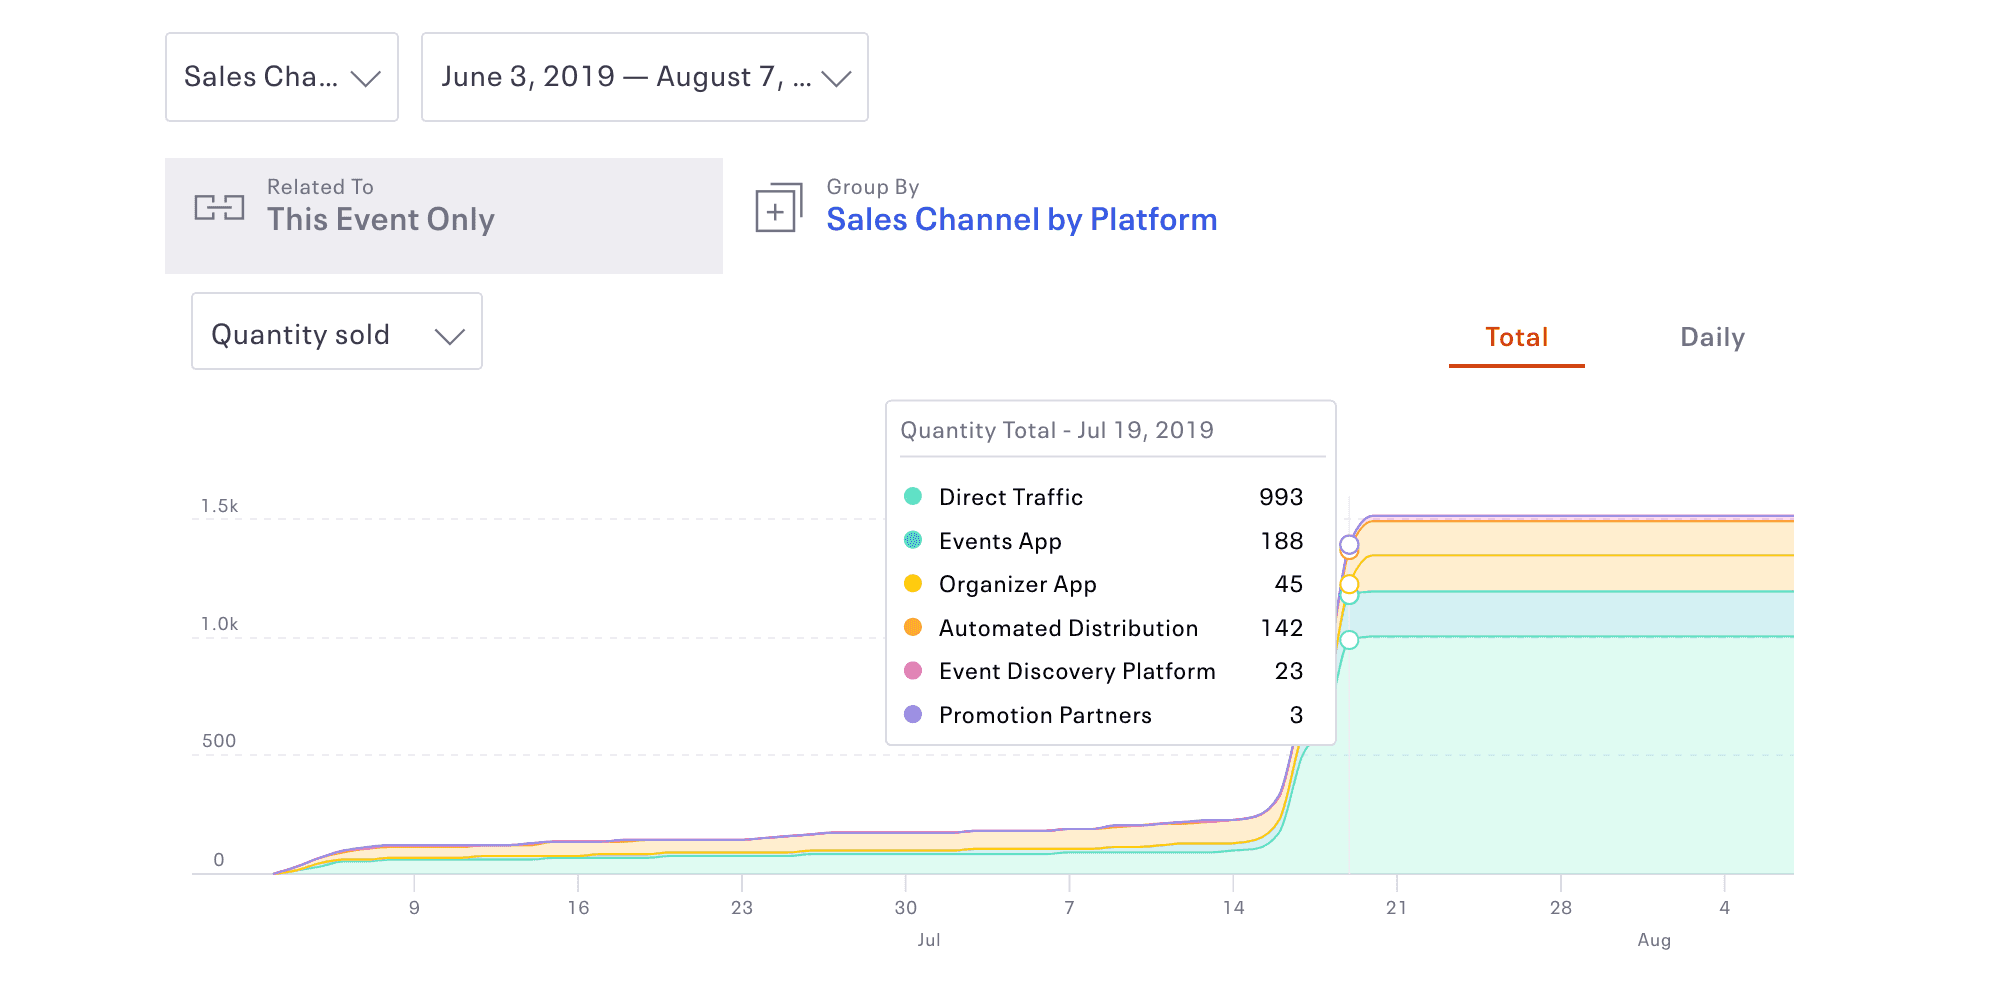
The Analytics Reports are a set of dashboards that show Eventbrite's event creators' data about their events. They are composed of seven different dashboards that provide information about Sales, Traffic, Attendee Geography, and Check-In levels, among others.
Role
During the two years I led the Frontend side of this project, I had the chance to:
- Architect and refactor old code using Backbone.js, Marionette.js, and unidirectional data flow to modularize and easily create new reports
- Extract the D3.js charting logic into Britecharts, simplifying the codebase
- Collaborate with Backend engineers to create new reports
- Implement new features like filtering and data aggregations to allow users to explore the data
Results
We built a reporting web application that is easy to extend with new reports and exposes the data in different formats and points of view.
Users can explore several data entries, aggregating different events, filtering, and grouping by various dimensions. We also provide data and chart export functions so they can use the insights in their custom reports –all with the beautiful charts of Britecharts.